laike9m
About me
- Work for Google
- Been using Python since 2012
- github.com/laike9m
Content of This Talk
What debugging is really about
- The history of debugging
- Rethink debugging: two pain points
- A novel approach
- Where do we go from here
What debugging is really about
- The history of debugging
- Rethink debugging: two pain points
- A novel approach
- Where do we go from here
Typical Errors
- Failed to compile (e.g. Syntax Error)
- Exit abnormally (e.g. Unhandled Exception)
- Program can run, but gives wrong results
- Result is correct, but program consumes more resources than expected (e.g. Memory leak)
Typical Errors
- Error generating bytecode (e.g. Syntax Error)
- Exit abnormally (e.g. Unhandled Exception)
- Program can run, but gives wrong results
- Result is correct, but program consumes more resources than expected (e.g. Memory leak)
In this context, debugging is about
Figuring out
why our program
gives the wrong result
What debugging is really about
- The history of debugging
- Two pain points
- A novel approach
- Where do we go from here
EDSAC
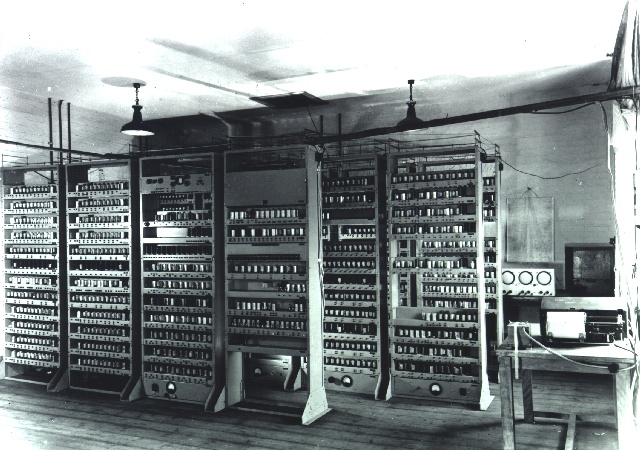
EDSAC I in June 1948
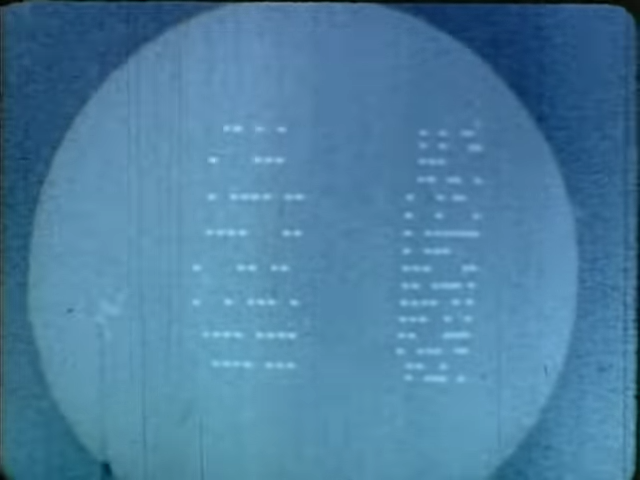
Debugging in EDSAC
... 'single-stepping' through the program and observing the contents of the memory and registers on the monitor tubes.
- The Airy Tape : an early chapter in the history of debugging

Debugging in EDSAC
"Software Aids"
- Post-morterm dump routine
Print out the contents of memory when a program has terminated abnormally or had been aborted. - Interpretive trace routine
For each instruction, print out diagnostic information, e.g. order code
Debugging in the 80s
- What was the first mainstream advanced debugger?
- Modern debuggers appear in the 80s
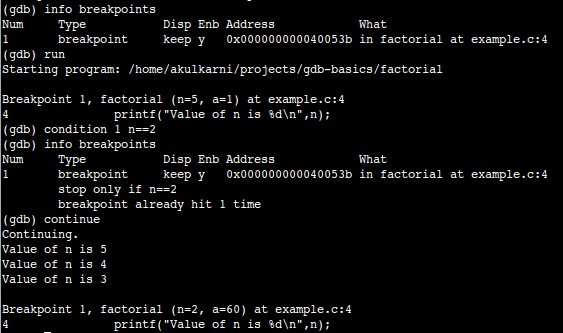
- GDB
Initial release, 1986
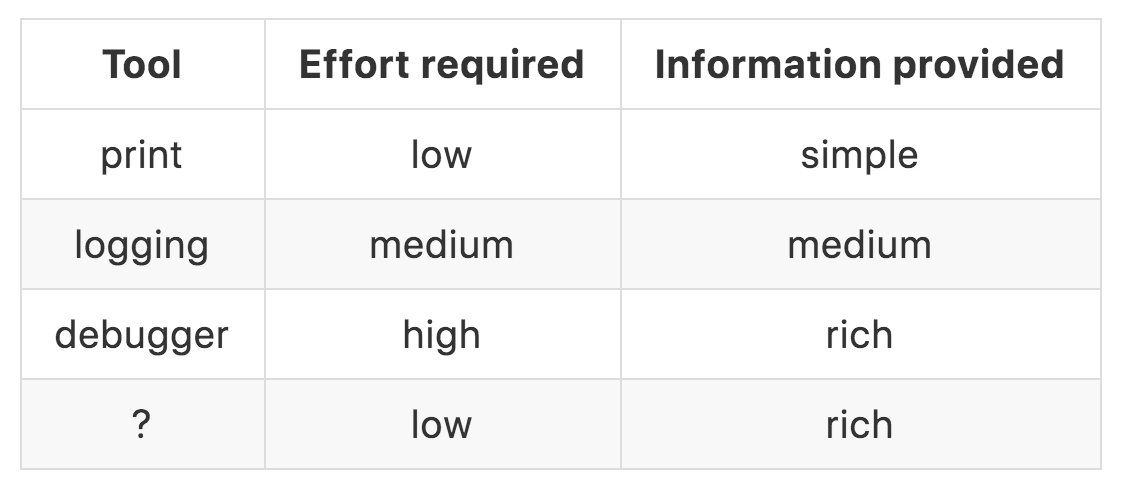
Debugging Methods
- print()
- Logging
- Debugger
- pdb(ipdb, pudb, etc)
- PyCharm
- VS Code
print()
On the other hand, often the quickest way to debug a program is to add a few print statements to the source: the fast edit-test-debug cycle makes this simple approach very effective.
-- Guido van Rossum
http://python.org/doc/essays/blurb.html
print()
I don't like debuggers. Never have, probably never will.
-- Linus Torvalds
https://lwn.net/2000/0914/a/lt-debugger.php3
Why print()
- Use out-of-the box
- No redundant information
- Normally won't change program's behavior
- "Has this line of code ever run?"
Why not print()
- Requires decent familarity with code
- Requires code modification
- Lacks context
- Hard to manage output
Logging
import logging

logging.debug('This is a debug message')
logging.info('This is an info message')
logging.warning('This is a warning message')
logging.error('This is an error message')
logging.critical('This is a critical message')
Why Logging
Configurable
Easy to manage output (e.g. Sentry)
Richer context (filename, lineno, etc)
Why not Logging
Config is cumbersome
logger = logging.getLogger()
handler = logging.StreamHandler()
formatter = logging.Formatter(
      '%(asctime)s %(name)-12s %(levelname)-8s %(message)s')
handler.setFormatter(formatter)
logger.addHandler(handler)
logger.setLevel(logging.DEBUG)
Not always available out-of-the-box
- Still, context is not enough
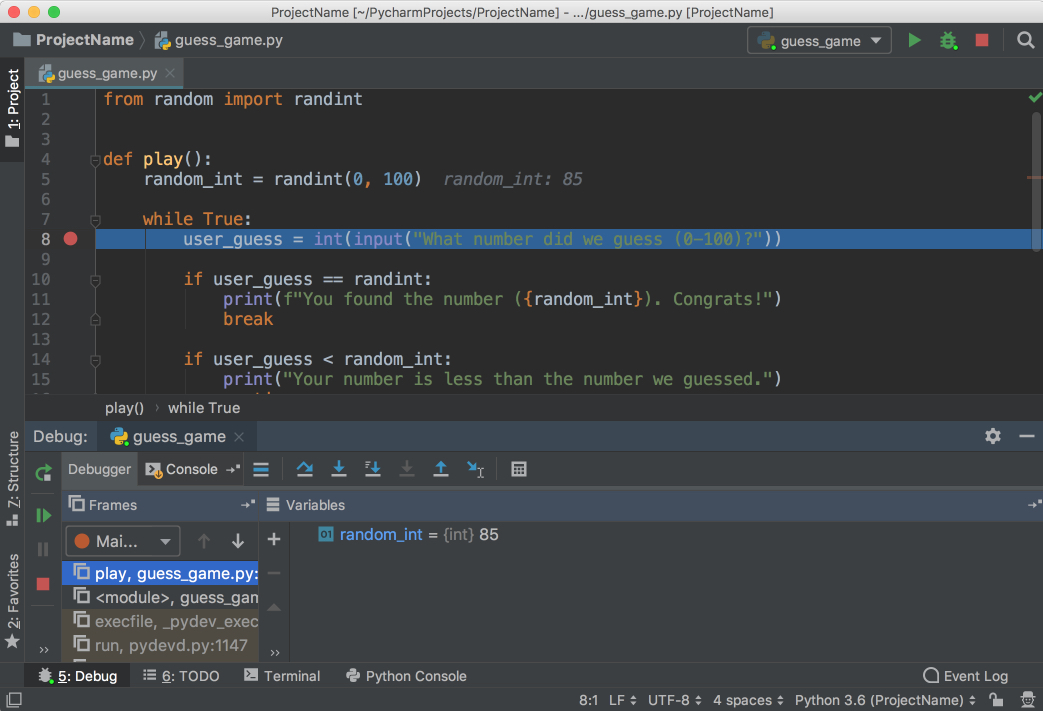
Debugging Methods
- print()
- Logging
- Debugger
- pdb(ipdb, pudb, etc)
- PyCharm
- VS Code
Why Debugger
Powerful, with more features
Doesn't require familarity with code
Helps you find root cause more easily
Why not Debugger
Depends on certain Lib/Editor/IDE
Some learning curve
No way to persist information
Performance issue
What debugging is really about
- The history of debugging
- Rethink debugging: two pain points
- A novel approach
- Where do we go from here
Pain point one
No tool that is as easy-to-use as print,
yet as powerful as a debugger
Pain point two
Existing tools only give clues,
without telling the why
Recap: debugging is about figuring out why our program gives the wrong result
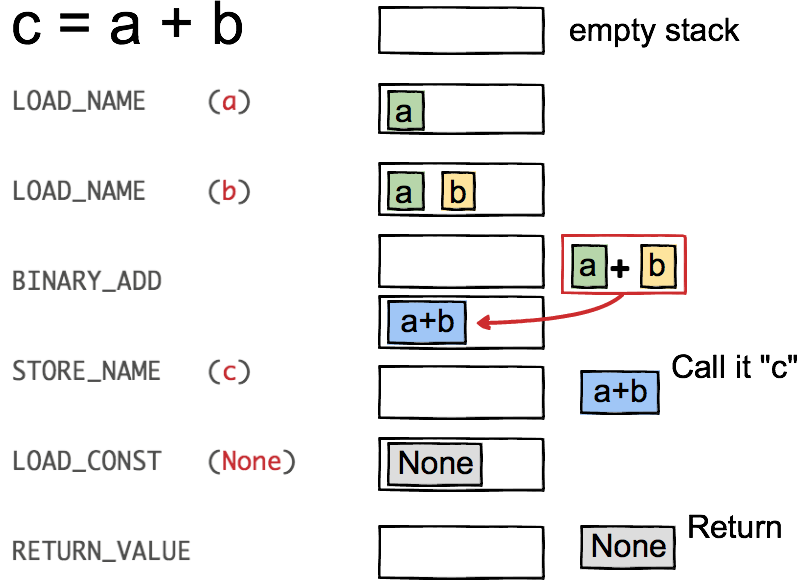
An example
c = a + b # c should be "foo", but instead is "bar"
- Set a break point at this line.
- Run the program, inspect the value of a and b.
- Figure out whether the error lies in a or b.
- Set another break point, repeat 🔁
An example
c = a + b # c should be "foo", but instead is "bar"
Set a break point at the program entry point
Step through and program
Util you reach c = a + b

Monitor relevant variables
Compare with
expected values
Use our brain to do all this
Memorize the results at every step
Yet, we don’t even
think it is a problem
What debugging is really about
- The history of debugging
- Rethink debugging: two pain points
- A novel approach
- Where do we go from here
An Ideal Debugging Tool
- Easy-to-use and provide rich information.
- Tell you why a variable has a wrong value with no or minimal human intervention.
Who has the information we need for debugging?
the Python interpreter
Python bytecode
>>> from dis import dis

>>> dis("c = a + b")
  1           0 LOAD_NAME                0 (a)
              2 LOAD_NAME                1 (b)
              4 BINARY_ADD
              6 STORE_NAME               2 (c)
              8 LOAD_CONST               0 (None)
             10 RETURN_VALUE
CPython Virtual Machine
Pull information
out of the interpreter
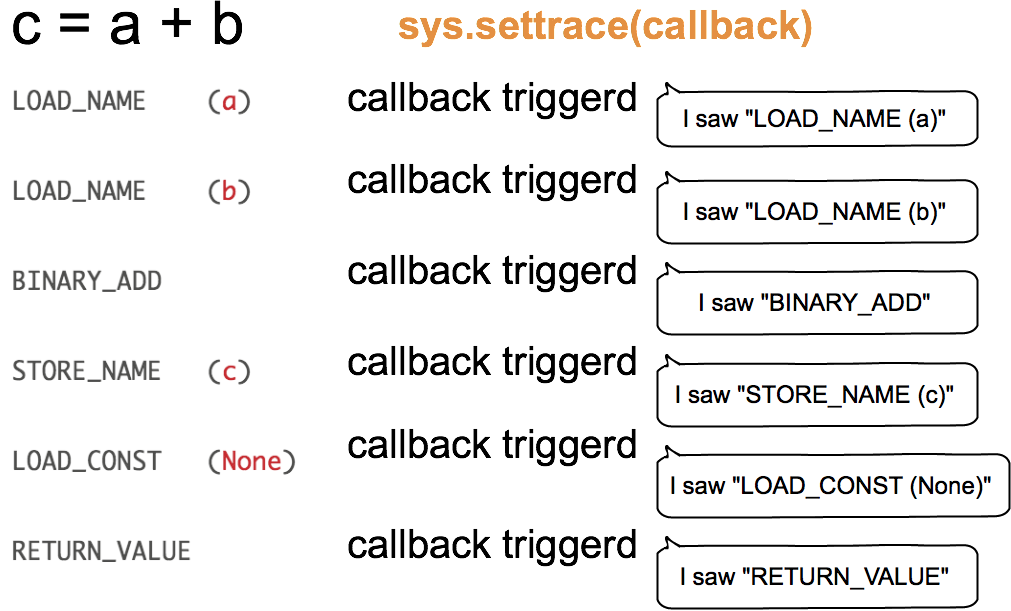
Let's use it for debugging
c = a + b # c should be "foo", but instead is "bar"
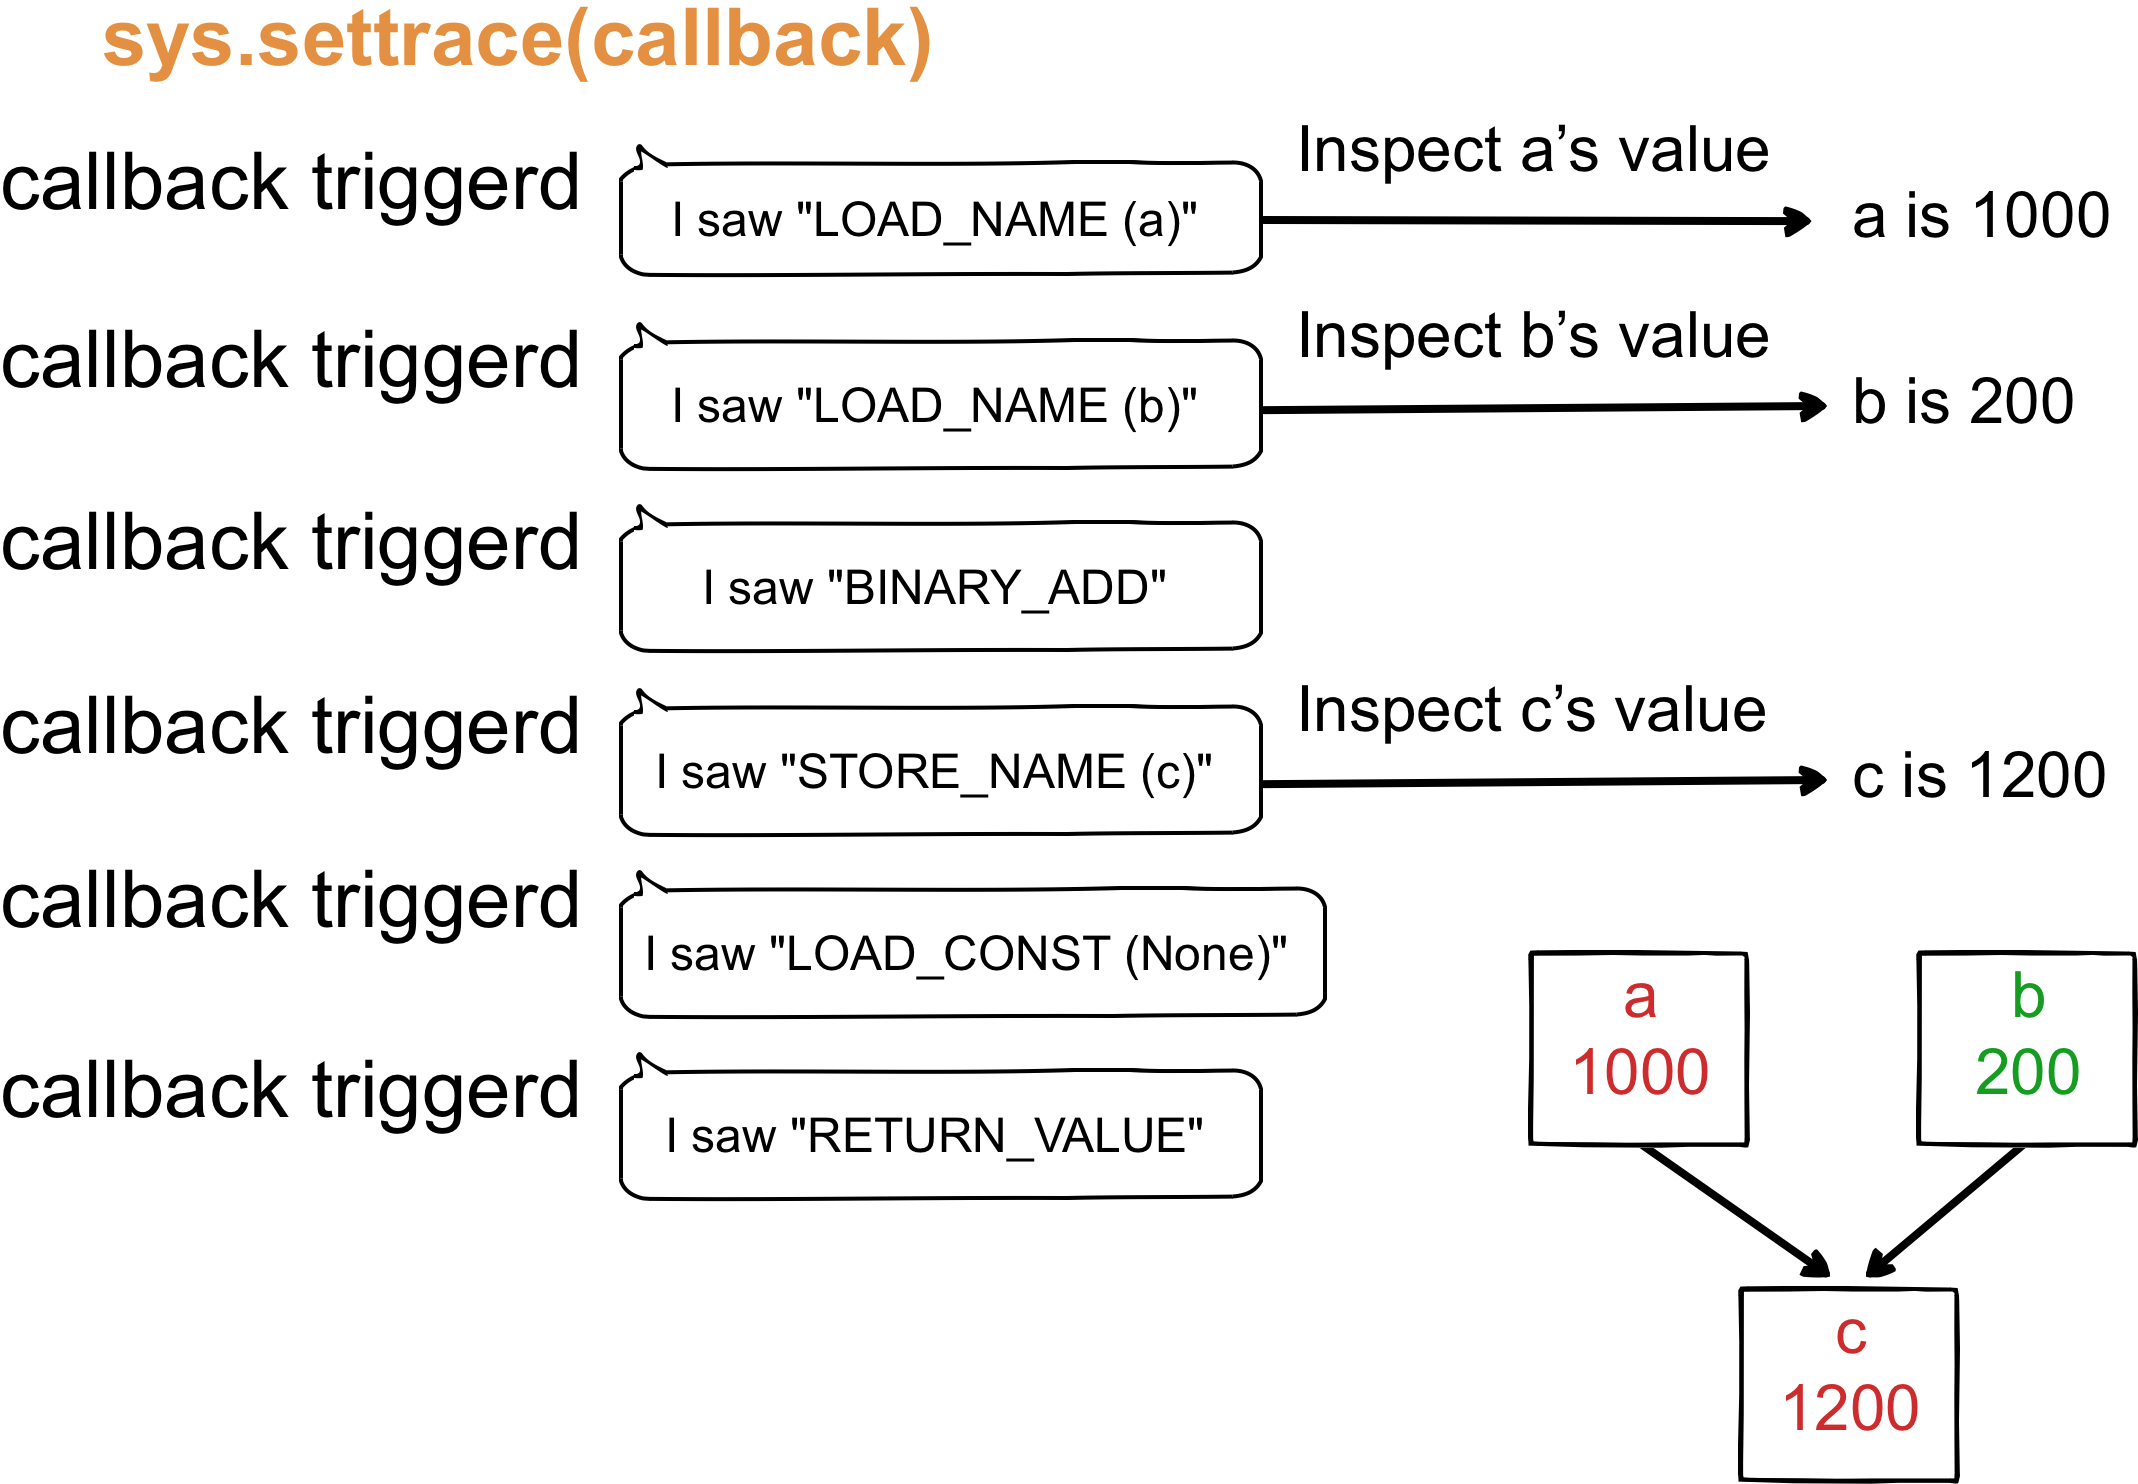
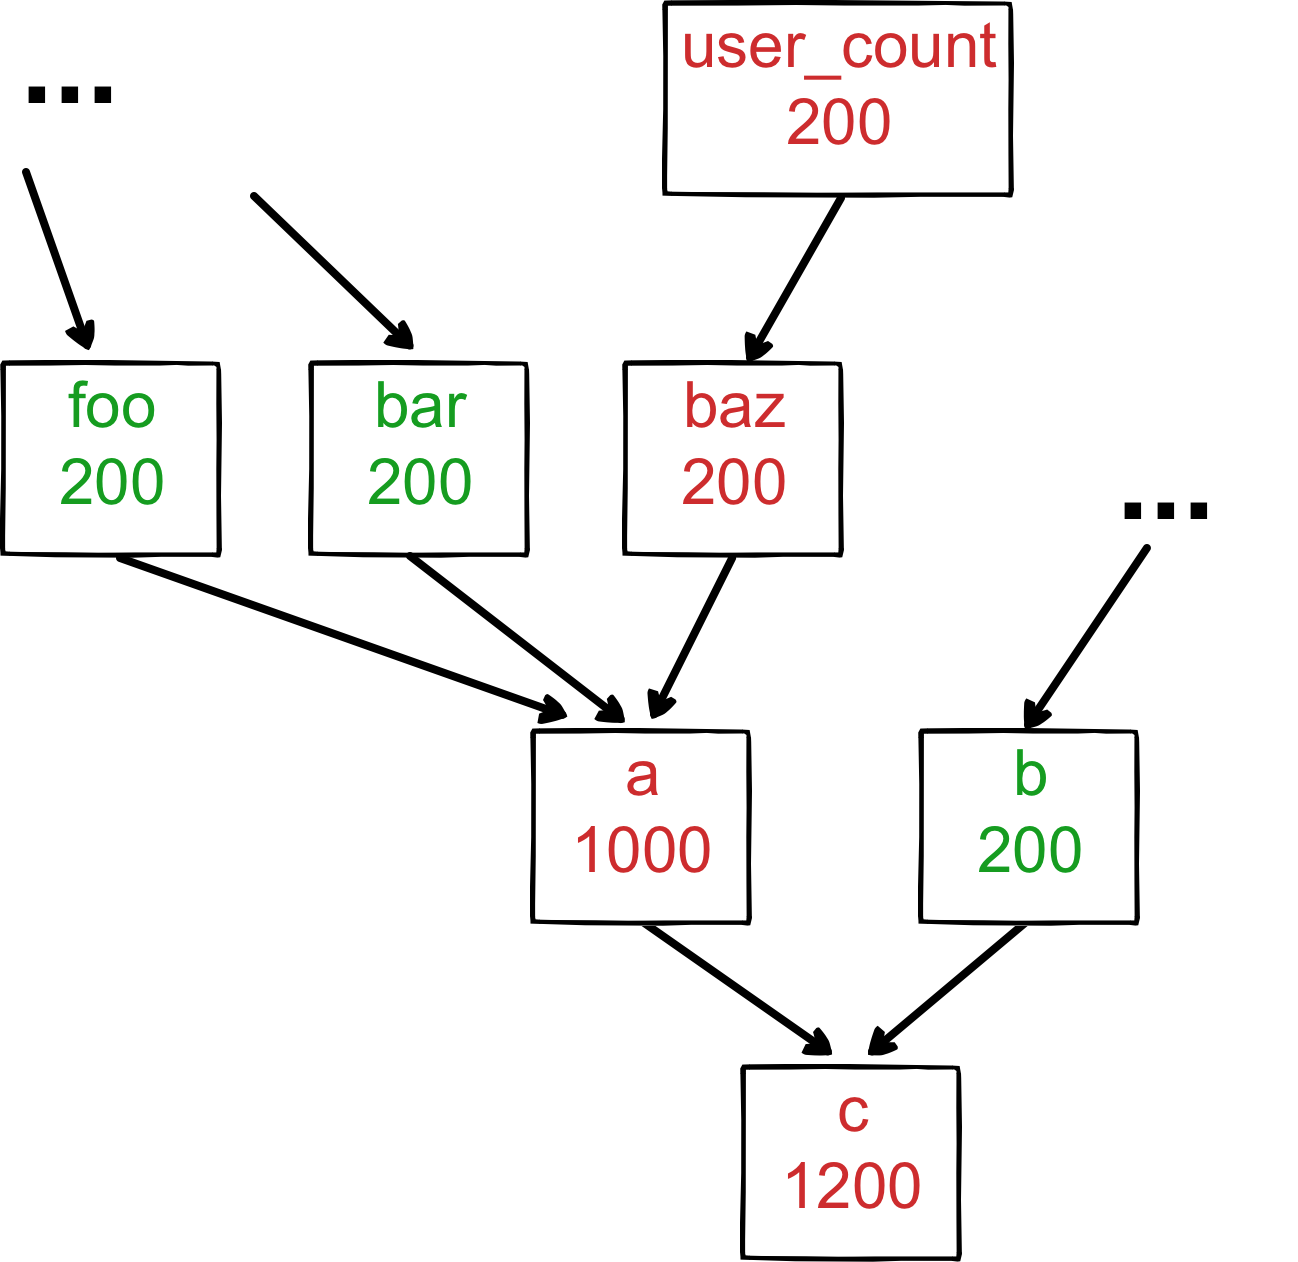
It is possible to backtrace errors reliably
What if there's a tool that can automatically generate this graph?
Demo: Cyberbrain
Cyerbrain solves the two pain points:
- It's easy-to-use and provide rich information.
- It tells you why a variable has a wrong value with little human intervention.
What debugging is really about
- The history of debugging
- Rethink debugging: two pain points
- A novel approach
- Where do we go from here
Existing tools are becoming calcified
DAP ( Debug Adapter Protocol )
New Tools
- PySnooper, IceCream, Hunter, pytrace: lets you trace function calls and variables with no effort, automating the process of adding print().
- birdseye, Thonny: graphical debuggers that can visualize the values of expressions.
- Python Tutor: web-based interactive program visualization, which also visualizes data structures.
- Cyberbrain.
An Example: PySnooper
with pysnooper.snoop():
    lower = min(lst)
    upper = max(lst)
    mid = (lower + upper) / 2
New var:....... lst = [681, 267, 74, 832, 284, 678, ...]
09:37:35.881721 line        10         lower = min(lst)
New var:....... lower = 74
09:37:35.882137 line        11         upper = max(lst)
New var:....... upper = 832
09:37:35.882304 line        12         mid = (lower + upper) / 2
74 453.0 832
New var:....... mid = 453.0
The tools we use have a profound (and devious!) influence on our thinking habits, and, therefore, on our thinking abilities.
- Edsger Dijkstra
What can we do?
- Think of new ways to make debugging better
- Create tools, or contribute to them
- Spread this talk and the ideas
- Create new programming languages that put debuggability as the core feature
keep an open mind.
Thanks
Q & A